 The main results of the 35th annual International Textile Machinery Shipment Statistics (ITMSS) released in May by the International Textile Manufacturers Federation show a decrease in total shipments of new textile machinery but also a new record in circular knitting machinesAfter a sharp reduction in global shipments of new textile machinery in 2008 and 2009 as a result of the global financial and economic crisis in 2008/2009, deliveries of new textile machinery jumped in 2010 and 2011, in most cases to new record highs. In 2012 shipments of new textile machinery fell in most segments in comparison to 2011. Looking at the past few years shipments remained relatively high. In comparison to 2011 global shipments of new short-staple spindles and open-end rotors decreased by -27% and -21%, respectively, whereas shipments of long-staple spindles increased by +29%. Shipments of new draw-texturing spindles declined by -13%, of new shuttle-less looms by -44%, and of new electronic flat-knitting machines by -34%. On the other hand worldwide shipments of new large circular knitting machines increased in 2012 by +27%.
These are the main results of the 35th annual International Textile Machinery Shipment Statistics (ITMSS) released in May by the International Textile Manufacturers Federation (ITMF). The report covers six segments of textile machinery, namely spinning, draw-texturing, weaving, large circular knitting, flat knitting and finishing machinery. The 2012 survey has been compiled in cooperation with some 122 textile machinery manufacturers, representing a comprehensive measure of world production.
Spinning Machinery
After shipments of new short-staple spindles plummeted in 2008 (-33%) and 2009 (-17%) they soared in 2010 (+75%) to pre-crisis levels and increased in 2011 by a further +15% reaching 14.33 million, an all-time high. In 2012 shipments of short-staple spindles fell by -27% to 10.51 million spindles. In 2012 94% of all shipped short-staple spindles were destined for Asia (9.91 million), with China alone absorbing 6.39 million or 65% of global shipments, followed by India as distant second (1.97 million spindles or 19%), Indonesia (594,000 or 5.7%), Turkey (441,000 or 4.2%) and Bangladesh (231,000 or 2.2%).
Global shipments of long-staple (wool) spindles soared in 2012 by +29% to 146,400. Europe was the main recipient (77,000 or 53%), followed by Asia (65,600 or 45%), the Americas (3,300 or 2.3%) and Africa (430 or 0,3%). The single biggest investor in long-staple (wool) spindles was Turkey (60,300), followed by Thailand (29,100), China (27,300), Italy (9,400) and Iran (6,800).
Investments in open-end rotors fell in 2012 by -21% to 451,200. Asia was once again by far the biggest investor in this spinning technology installing in total 408,260 new rotors or 90% of global shipments. By country, China was again by far the biggest single investor in rotors absorbing 363,950 or 81% of global shipments. India was again distant second with a total of 19,400 new open-end rotors (4.3%), followed by Turkey with 17,500 rotors (3.9%), Brazil with 11,100 rotors (2.5%), Uzbekistan with 8,900 rotors (2.0%) and Malaysia with 6,800 rotors (1.5%).
Texturing Machinery
In 2012 there were no shipments of single heater draw-texturing spindles (mainly used for polyamide filaments). From 2010 to 2011 shipments fell from 13,200 to 1,824 (-86%).
In the segment of double heater draw-texturing spindles (mainly used for polyester filaments) investments dropped from an all time high of 826,500 texturing spindles in 2011 to 717,800, a decrease of -13%. 90% of all shipments went to Asia. By far the biggest single investor of this type of draw-texturing machinery was again China where 489,600 new spindles or 68% of global shipments were installed, followed by distant second India with 44,400 or 6.2%, Thailand and Japan with 36,500 or 5.1% each, and Turkey with 17,000 or 2.4%.
Weaving Machinery
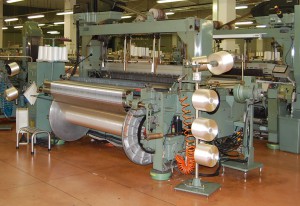
Worldwide shipments of shuttle-less looms plummeted in 2012 to 86,450 machines, a fall of -44% from last year’s record of 153,750. The main reason behind this development is the decline in shipments of water-jet looms. After a skyrocketing jump of +537% to 73,250 in 2010 and to 112,930 in 2011, which was partially due to the fact that more weaving machinery manufacturers reported for the first time in 2010, global deliveries of water-jet shuttle-less looms dropped by -65% to 39,920 machines in 2012. In the shuttle-less loom segment of rapier/projectile looms shipments increased from 19,250 in 2011 to 23,250 in 2012, an increase of +20%. Also deliveries of shuttle-less air-jet looms increased from 21,500 in 2011 to 23,300 in 2012 (+8%). As in previous years the main destination of shuttle-less looms was Asia, where 80,600 or 93% of all new shuttle-less looms were installed. Country-wise the biggest global investor was again China with 58,900 looms (68%), of which 34,400 were water-jet looms, 16,000 air-jet looms and 8,500 rapier/projectile looms. With 10,200 looms (12%) of global shipments India was the second biggest investor, followed by Indonesia with 3,730 (4.3%), Turkey with 2,570 looms (3.0%), Bangladesh with 1,600 (1.9%) and Korea with 1,350 looms (1.6%).
Circular & Flat Knitting Machinery
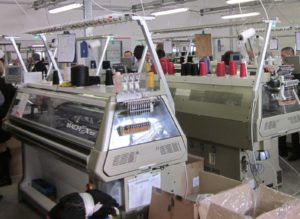
 Global shipments of large circular knitting machines increased by +27% from 28,900 in 2011 to 36,650 in 2012 which set a new record. Also in this segment Asia was the main regional investor in this type of machinery absorbing 33,600 units or 92% of all machines shipped in 2012. The biggest single investor was once more China with a total of 28,280 (a global market share of 77%) followed by Turkey with 1,420 (or 3.9%), Indonesia with 1,350 (or 3.7%), India with 1,200 (or 3.3%) and Bangladesh with 735 (or 2.0%).
In the segment of electronic flat knitting machines, global shipments in 2012 dropped by -34% to 46,100 machines. The bulk of global shipments of electronic flat knitting machines was delivered to Asia (40,940 or 89%), while Europe’s share (including Turkey) reached 10%
(= 4,670 machines). The biggest single investor in 2012 was again China, where 33,040 new machines (72%) were installed, followed by Bangladesh with 4,360 (9.5%), Turkey with 2,660 (5.8%), Hong Kong with 1,090 (2.4%) and Italy with 826 (1.8%).
The 2012 edition of ITMF’s International Textile Machinery Shipments Statistics included for the eighth time also data on finishing machinery (wovens and knits continuous machinery).


